Power BI for Marketing: Cut the Noise, See the Facts

You are staring at 15 Excel tabs and still can’t figure out why your conversion rate has tanked.
Power BI isn’t a silver bullet. However, it is the only native environment within the Microsoft ecosystem where data from ad accounts, CRMs, and warehouses can converge without jumping through technical hoops. You can launch basic analytics in a single day without any coding skills. From there, the sky is the limit.
Let’s break down exactly what this offers a marketer, a PR pro, and an SEO specialist. No fluff—just facts and use cases.
Data Isn’t Scattered—It’s Centralized
Power BI pulls information from everywhere. Literally. Databases, Excel, CRMs, advertising channels, and analytics. Whether you upload a file or provide an access link, the system syncs everything automatically.
How does this change your workflow?
- Marketers stop guessing which channel brings in loyal customers and which just generates “empty” leads. Power BI links specific ads directly to sales recorded in the CRM.
- SEO Specialists get more than just “traffic is up 20%.” They get a forecast: how shifts in rankings will impact revenue during the low season.
- PR Managers can stop reporting with endless lists of links. The system tracks the actual footprint of publications through hard sales data.
Internal data is protected by encryption. Security is one less thing for you to worry about.
Visualization That Tells the Truth, Not Just Pretty Pictures
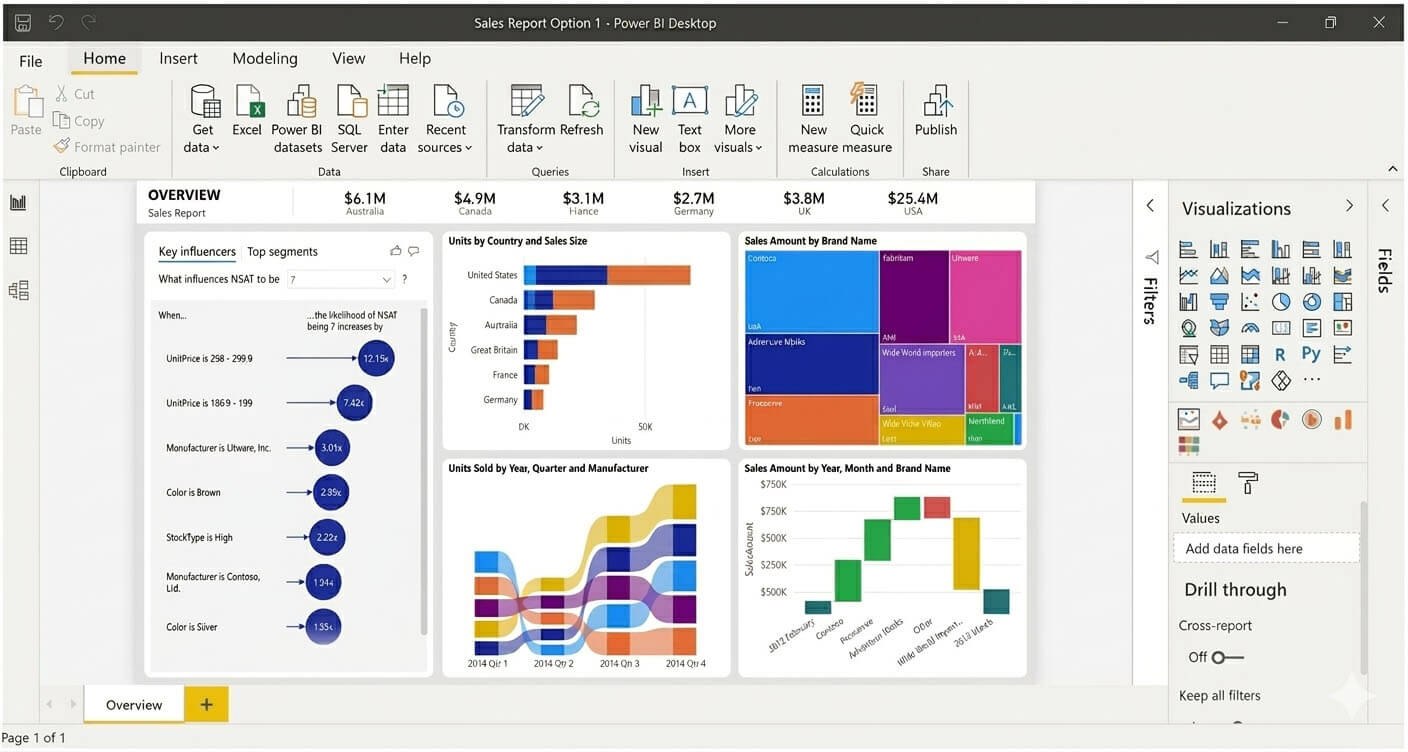
A pie chart is useless on its own. It only becomes valuable when it’s “live.”
Power BI creates dashboards that update in real time. If you embed a report into PowerPoint, the numbers won’t lie during your presentation—they “pull” from the source a second before your slide appears.
Example for a Sales Department: A pie chart showing deals per manager. The system notices two top performers are on vacation and sales have dipped. You don’t have to dig through logs, Power BI’s “Anomaly Detection” feature will highlight the drop-off point and identify the cause.
And yes, it provides explanations (a graph combined with a brief analysis), provided the data volume is sufficient for statistical significance.
Forecasting Without a Crystal Ball
Built-in machine learning isn’t just a marketing gimmick.
You build predictive models based on historical data. For example: “What will happen to profits during the off-season if we double our PPC budget?” Power BI provides concrete figures rather than “it will likely grow.”
The “Q&A” feature (currently in English) allows you to ask the system questions using natural language. You receive your answer in the form of a graph or table.
If the standard visualizations don’t cut it, you can bring in a BI expert to write a custom report. But the foundation is yours to manage.
Three Interfaces: Two for Fast Decisions
| Version | Functionality | Target Audience |
|---|---|---|
| Power BI Desktop | Full cycle: collection, processing, dashboards, and forecasting. | Analysts and marketers building complex models. |
| Power BI Mobile | View-only, filtering, and report sharing. | Executives, field employees, or PR pros at events. |
| Power BI Cloud | Centralized publishing and collaborative access. | Teams of 3+ people and external contractors. |
What Exactly Should You Analyze? Here Are Your Scenarios:
Marketing and Sales
- Campaign effectiveness by channel.
- Each manager’s individual contribution to the funnel.
- Product lines: what’s flying off the shelves and what’s “dead weight.”
For the SEO Specialist:
Traffic forecasting linked to inventory levels. You see that rankings will climb in two weeks, but you only have three days of stock left in the warehouse. You have enough lead time to warn the procurement team.
A Practitioner’s Perspective (The Counter-Intuitive Advice)
Power BI is not for micro-businesses. At all. If you have one advertising channel, ten regular customers, and a negligible financial turnover, you’ll spend more time setting up reports than reading them.
However, the moment you have three data sources (CRM, Ads, Warehouse) and two people who need different data slices—Power BI pays for itself within the first month.
3 Steps to Start Right Now
- Connect two sources. Try Google Analytics + your CSV sales export. See how the system links clicks to closed deals.
- Build one live report. Embed it into PowerPoint for your next briefing.
- Appoint a “Data Hygiene” Lead. Power BI cannot fix “garbage in, garbage out.” Agree on standardized directories and naming conventions within your CRM.